Clustering over the BeNeLux – Modelling of dependent windstorms
Clustering over the BeNeLux – Modelling of dependent windstorms
Every winter the Netherlands is hit by several storms. Those extreme winter storms can cause big losses for insurers and are the most damaging insured natural catastrophes in the Netherlands. Therefore this risk is often reinsured and this makes catastrophe risk a highly important risk for both non-life insurers and reinsurers. When a windstorm arrives in the European mainland, there appears to be an increased chance of another storm arriving (clustering)1. This weather feature has recently gained attention of catastrophe modellers and the nonlife insurance industry and is important in the determination of capital requirements. When storms arrive in clusters these storms might be dependent events which require more risk capital. This article describes the modelling of catastrophe risk and dependent windstorms, the definition of clustering and the processes underlying windstorm risk.
Catastrophe models
The capital requirements for insurers and reinsurers can be calculated according to the standard model specifications of the European Insurance Authority (EIOPA). These specifications explicitly assume two consecutive storms to be independent. However, for the correct modelling, in for example an internal model or reinsurance pricing, the effect of clustering should be incorporated.
Catastrophe risk is furthermore often calculated for (re)insurers by specific vendor models. They design their models based on weather and exposure data and sell the results of these calculations. Catastrophe models consist of several modules that perform the calculations. First a hazard module generates the storms and their intensity combined with an exposure module that gives all the relevant characteristics of the insured values. Then the vulnerability module calculates the resulting damage. Finally, the financial module exists to calculate the financial consequences of the catastrophes as generated in the other modules. Modelling windstorm catastrophe risk with these meteorological predictions is preferred above using just industry loss information, since there is a lot more meteorological information available than loss information from large windstorms (especially at individual (re)insurer level). In the remainder of this article we will not go into detail of catastrophe modelling but we will focus on the modelling of clustering in storm arrival. This modelling can be part of the hazard module of windstorm catastrophe models. Another possible place to incorporate the effects of clustering is the financial module. Here the predicted loss can be amplified: post loss amplification.
The negative binomial distribution show the best fit to model storms per winter
Storm arrival
Based on Dutch and Belgian weather data, we constructed a model for the arrival rate of severe storms. To model the dependence in the arrival of storms per winter, we identified a list of storms from wind gusts data of the Belgian and Dutch Royal weather institutes. The storms are identified using the method that is often used in other studies2. The two percent heaviest gusts per weather station are normalised, cubed and summed to get arrival dates of storms. Contrary to the usual assumption of independence the weather data showed clearly overdispersion. Apart from the homogeneous Poisson process other theoretical distributions with a parameter for dispersion are fitted on the observed distribution of storms per winter. Of this distributions the Negative Binomial distribution shows the best fit to model storms per winter. In addition, the excess of winters with zero heavy storms is modelled with zero-inflated and zero-adjusted models which also improve the simple Poisson model.
Modelling clusters
An alternative to the modelling of storms per winter, that comes closer to the actual process underlying the cluster development is the PoissonBinomial model. In this model the number of clusters per winter and the size of the clusters are estimated separately. Storms arriving together in time windows of seven, fourteen or thirty days are identified as clusters.
Tabel 1 Observed clusters per cluster size per window based on 44 observed winters in BeNeLux. Example: For a 14 day time window, 21 clusters of two storms (cluster size 2) were observed in the last 44 winters.
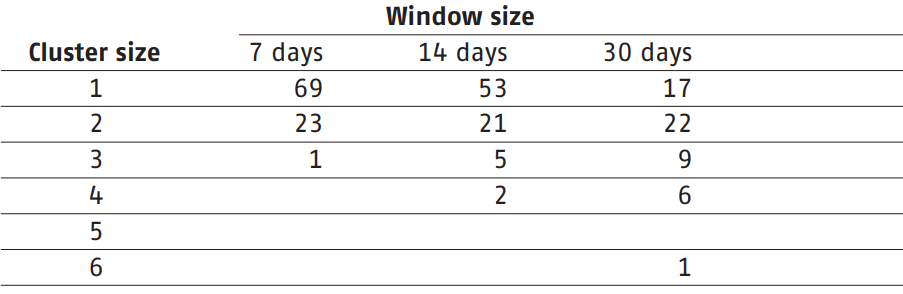
The number of clusters is estimated with a homogeneous Poisson process after which the cluster size is estimated with a Binomial distribution. When defining clusters as storms arriving within seven or fourteen days the Poisson-Binomial distribution fits well. However, when increasing the time frame to thirty days the predictive power diminishes. This makes sense since less information about the interarrival times of storms is used. Estimation of this model is a step in the definition of clustering.
The correction on the premiums can be up to eight percent
Pricing
Based on the estimated distributions, the effect of clustering on insurance premiums can be calculated3. Premiums are based on the occurrence exceedance probability – the distribution of the maximum loss in a given year. They are the integral over this distribution till the expected level of loss for one event. For multiple events (a cluster) the probability conditional on at least one event should be taken. This probability depends on the parameters of the chosen distribution. The correction on the premiums can be up to eight percent.
Post loss amplification
An alternative to the statistical modelling of clusters is the possibility to incorporate clustering in the post loss amplification. This alternative approach overcomes problems that arise when one tries to combine the probabilities of losses in a statistically correct manner. Instead, the losses of a first storm are enlarged for the possibility of losses due to following storms. However, this needs good expert judgment back-up.
Clustering or coincidence
Obviously, insurers are mostly interested in the number of storms that are actually arriving over the BeNeLux. Nevertheless, we believe it is important to understand the underlying processes of dependent development of storms when modelling the losses. The storms arriving within short time intervals do not necessarily have the same origin. To describe the clustered arrival, a distinction is made between secondary cyclogenesis, clustering due to large scale pressure variations, and storms that appear to arrive independently. To investigate nine periods of severe storms in the last twenty-five years and the different ways clusters develop, we wrote a JavaScript application. The visualisation is a powerful tool to compare the tracks and developments of storms in time. In two of those nine periods the first storm seems to initiate a second storm (secondary cyclogenesis). In four periods the storms develop separately but are steered to the European coast by large scale pressure patterns. In two periods the storms arrive together, but develop and travel independently over the ocean. A period consisting of four big storms shows all of the three effects above and is a good example of the complexity of the processes underlying cluster development.
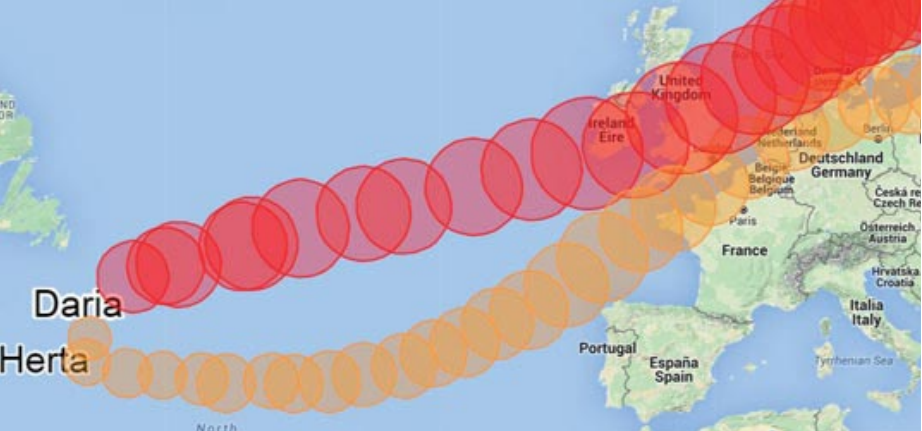
Figuur 1 Example of secondary cyclogenesis. In January 1990, a first storm (Daria) initiates the second storm (Herta).
Recent attention to clustering and the non-disclosure of the methods used in vendor models gave rise to the question how windstorm risk should be modelled. Weather data show clear dependence in arrival and there are several suggestions to improve the current models. This risk of dependent events might be costly for insurers and reinsurers. Insurers should also consider to investigate the effect of storm intensity and climate on cluster development. The challenge will remain to model the storm arrivals as simply as possible while considering all factors that play a role and are relevant for insurers.
Publicaties
 Alle publicaties

Tom Veerman
Is there a level playing field in the Dutch market of Residential Mortgages?
To avoid cross-sector arbitrage, the European Commission has announced its intentions to “align” capital requirements for mortgages for insurers under
Thom Peters
Reservering vanuit actuarieel perspectief en de impact van negatieve rekenrentes
In dit artikel bespreken Cees en Nico de totstandkoming van de voorzieningen van een verzekeraar, de uitdagingen hierbij voor letselschadeclaims en de impact van negatieve rekenrentes.
Frank van Houdt
Scenariobedragen leiden tot betere pensioneringskeuzes
Een goede pensioneringskeuze vereist goed inzicht in de uitkomsten. Deelnemers waarderen scenario’s hierbij en deze beïnvloeden het keuzegedrag dan ook significant. In dit artikel toont Triple A – Risk Finance collega Wouter Otten de meerwaarde aan van URM-scenario’s voor pensioneringskeuzes.-
-
Wilt u meer informatie of een afspraak maken?
Neemt u dan contact op met Joanne Bouwkamp

Neem contact met mij op
© 2026 AAA Riskfinance. Alle rechten voorbehouden.